Smartphone Addiction Among University Students:
Problems and Possible Solutions
Elena Tsomko
Dept. of Computer Engineering, Dongseo University
GSI, Jurye-ro 47, Sasang-gu
Busan, Korea
elena@gdsu.dongseo.ac.kr
Abstract
It is already accepted that smartphones have been adopted in almost every sphere of our lives: personal, professional, educational. This technological innovation provides access to the internet, documents in various formats at all times, allowing us to process data faster, learn new things easier, improve our working performance, effectiveness, productivity, etc. A lot of mobile applications have been developed for educational purposes targeting to help students with their studies. Universities develop their own mobile applications in order to help students control their curriculum, check schedules, assignments, participate in projects and other activities. And with such an increase of smartphones usage, we now face quite a prevalent issue – smartphone addiction. The purpose of this paper is to study how university students use their smartphones, what level of smartphone addiction they have and what impact it has on their educational performance.
Keywords-smartphones; smartphone addiction; education; university students
1. Introduction
Rapid development of mobile technologies brings a lot of comfort to every sphere of our lives: we use mobile devices at universities, working places, homes, while travelling, doing sports exercises, etc. Smartphones are one of the most popular mobile devices we employ in our everyday routines. If we look at some statistics in smartphones ownership by age groups (e.g., in [11]), we can see that the majority of smartphone users are in the age groups 18-29 and 30-49. The first age group includes a lot of college/university students who supposedly use smartphones in their educational life as well.
A number of studies has been done in order to evaluate to what extent university students use their smartphones for educational purposes, investigate which cognitive factors influence the continued use of smartphones and how smartphones can be used in classrooms for measuring students’ attentiveness in lectures. Along with the latter studies, some research papers suggest effective methods of using smartphones in classroom environments and outside.
Our research is devoted to a study of smartphone addiction level among university students and what relation does it have to their use of smartphones in personal/social and educational life. For the purpose of this study we performed a survey among undergraduate university students, with quantitative analysis of its results.
The structure of this article is organized as follows: Section 2 briefly describes previous studies on use of smartphones among students; in Section 3, we describe our research method with its results; Section 4 concludes the paper.
2. Previous Studies on Use of Smartphones in Higher Education
A number of research papers introduce results on studies about students’ preferences in use of smartphones. For instance, Feng et al. [1] in their research about students’ preferences and intention on using smartphone education applications found that educational performance expectancy has the strongest predictor of behavioral intention. Therefore, people who expect higher on their own performance by utilizing technology are more likely to adopt smartphone learning apps. It is also shown that most learners prefer visual learning style, where diagrams and graphs can help learners to gain information and memorize things, which in turn suggests to utilize more pictures and diagrams in order to enhance the educating functions of smartphone apps. Research results of Morphitou [4] show that an increasing number of students do use their smartphones for educational purposes and in many situations replacing the use of laptops. This study discovered that 41% of the respondents said they have downloaded apps to help them with their studies and education whereas the most popular choice was instant messaging apps (51.4%).
The cognitive factors that influence the continued use of smartphones by college students had been investigated by Idemudia et al. [3]. Their model indicates that both familiarity and cognitive trust in the integrity of a smartphone have a positive and significant effect and explains 79% of smartphone continuance usage, which, in turn, made authors to suggest the following investigation of factors relating to Visual Perception Theories that directly influence smartphone continuance usage. It is also shown that accessibility of smartphone and smartphone satisfaction explains 52% of cognitive trust in integrity for a smartphone.
Other studies suggest how to use smartphones in the classroom in order to improve students’ attentiveness, increase their motivation to study harder and improve students learning concentration. Höver and Mühlhäuser [2] developed a system called “Classquake” that uses students’ smartphones as decentralized sensors to measure their activity and attentiveness during lectures. The system aims at supporting lecturers to recognize a decline of students’ attentiveness in order to start appropriate countermeasures like short breaks, which can recover the level of attention. Rothe [6] and Yamamoto [9, 10] suggest to employ special smartphone applications in order to better handle classrooms and improve students learning motivation and self-learning: Pingo app and the software configuration for lecture record, respectively. Both application suggest real-time interaction between students and lecturers at specific stages of the lectures. Another learning motivation improvement with use of smartphones is suggested by Shirali-Shahreza et al. [7] where computer science students should be involved in real-world problems. Example problem introduced in their paper is to ask students implement the FFT (Fast Fourier Transform) algorithm on a PC and then port the program to a smartphone using J2ME (Java 2 Micro Edition) programming language. It is supposed that by doing this project, the undergraduate computer science students will become familiar with the limitations of small devices such as smartphones.
There are a few studies on smartphone addiction which are focused more on general groups of users and either analyze factors that contribute to smartphone addiction or suggest some intelligent systems to reduce and/or prevent smartphone syndrome. For instance, Rapeepisarn et al. [5] aimed to develop an Android application, namely iRelief, which could keep track and collect information about smartphone usage, measure percentage and level of smartphone addiction as well as provide basic knowledge about smartphone addiction, smartphone syndrome, and yoga. In addition, the application offered a yoga treatment solution to prevent and relieve symptoms caused by smartphone addiction syndrome.
As can be seen from the above research papers review, no specific study had been performed on the detailed purposes of use of smartphones by students along with the study on their smartphone addiction level. Following we introduce our investigation on this issue and analyze its results.
3. Research Method
For the purpose of this research paper it was decided to perform a descriptive quantitative analysis for more conclusive results. 51 undergraduate international students (from freshmen to seniors) of Dongseo University from Computer Engineering (CE) and Business Administration (BA) departments participated in a personal survey in September 2018. The participants’ characteristics in our study are shown in Table 1.
3.1. Survey Preparation
A personal questionnaire has been developed for a survey. It consists of three parts: the first part includes questions about students’ preferences in use of smartphone (e.g., phone calls, chatting through instant messengers, checking SNS, reading/watching news online, studying/doing homework, playing games, etc.) where students have to select an answer in the range from 1 (never use) to 7 (most of the time) and statements related to the students’ attitude in smartphone usage, with indications ranging from 1 (strongly disagree) to 7 (strongly agree); in the second part students are requested to visit online test on adult Attention Deficit Disorder (ADD) or Attention Deficit Hyperactivity Disorder (ADHD) [13]; the third part requires students to go through the nomophobia test [12] in order to evaluate their level of smartphone addiction.
Table 1. Characteristics of the Survey Participants
|
no. of Male/ Female students |
Students’ age |
Departments |
Students’ year of study |
Years of using smartphone |
|
Male – 51 (100%) Female – 0 (0.0%) |
18y.o. – 4 (7.84%) 19y.o. – 8 (15.69%) 20y.o. – 10 (19.61%) 21y.o. – 20 (39.22%) 22y.o. – 5 (9.80%) 23y.o. – 3 (5.88%) 24y.o. – 1 (1.96%) |
CE – 36 (70.59%) BA – 15 (29.41%) |
Freshman: 18 (35.29%) Sophomore: 7 (13.73%) Junior: 20 (39.22%) Senior: 6 (11.76%) |
1yr – 2 (3.92%) 2yrs – 1 (1.96%) 3yrs – 6 (11.76%) 4yrs – 6 (11.76%) 5yrs – 10 (19.61%) 6yrs and more – 26 (50.98%) |
3.2. Survey results
For the purpose of better understanding of smartphone addiction situation among university students, let us start with analysis of the first part of the survey. The questions about use of smartphones are duplicated for two categories: use during lectures and use outside of lectures. Fig.1 and Fig.2 show the results respectively. It is evident from these Figures 1 and 2 that majority of students do not use smartphones during lectures for such purposes as listening to music, watching videos, playing games, and phone calls. However, there are some peaks in the histogram of respondents’ answers distributions indicating that more than half of students “sometimes” (4) and “often” (5) use smartphones during lectures for studying – 16 (31.37%) and 12 (23.53%) students respectively. According to the additional comments in the questionnaire, computer engineering students sometimes use their smartphones in classes while learning and developing Arduino projects with use of smartphones or access online E-class system to open study materials for the lecture.
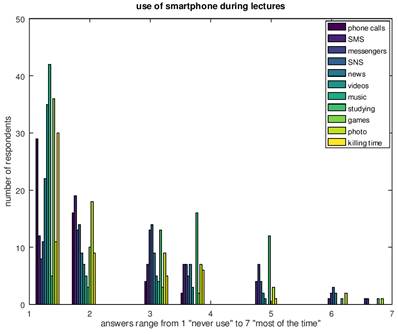
Fig. 1 Respondents’ answers on use of smartphone during lectures.
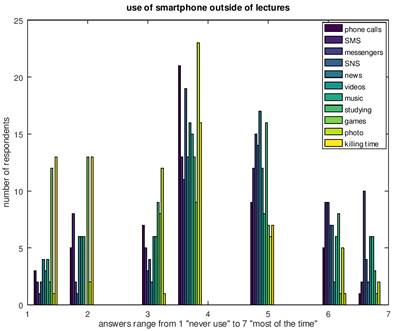
Fig. 2 Respondents’ answers on use of smartphone outside of lectures.
As for use of smartphones outside of lectures, Fig.2 shows that most popular answers belong to such purposes as: taking photos, phone calls, checking SNS – “sometimes”; to check news, to study/do homework, to chat through instant messengers – “often”; to send SMS and chat through instant messengers both have high peaks in “very often” and “most of the time” responds.
Next, we show results on the amount of hours students spend in average per day using their smartphones (separate on weekdays and weekends). According to Fig.3 majority of students spend more time with their smartphones on weekends: 7 hours and more – 15 respondents (29.41%), up to 6 hours – 8 respondents (15.69%), up to 5 hours – 10 respondents (19.61%); whereas high peaks on use of smartphones on weekdays are distributed as follows: up to 3 hours and 7 hours and more – equally, 8 respondents (15.69%), up to 4 hours – 12 respondents (23.53%), up to 5 hours – 13 respondents (25.49%).
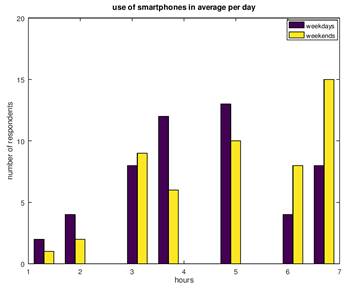
Fig. 3 Average hours spent on using smartphones per day.
Fig.4 illustrates results of students’ responds to rate: (a) how often they use smartphones to find (search online, ask friends, etc.) answers/solutions/ hints for their homework assignments; (b) to study, learn some new, additional theories related to their courses. It is evident from the graph that majority of students rated these two statements as “sometimes” (27.45% (a) and 21.57% (b)), “often” (27.45% (a) and 31.37% (b)), “very often” (21.57% (a) and 31.37% (b)), and “most of the time” (9.80% (a) and 7.84% (b)).
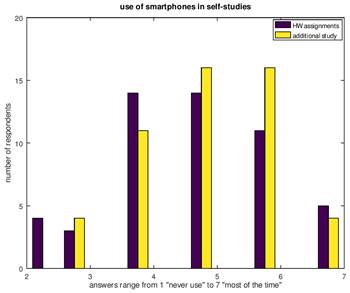
Fig. 4 Use of smartphones for homework assignments and self-studies.
An interesting fact can be observed from Fig. 5 – it shows results of students’ perception on their skills to (a) learn an understand new materials easily and (b) to easily memorize and remember for a long time new theories related to students’ studies. Statements (a) and (b) on evaluation of these skills are suggested to be rated from 1 (strongly disagree) to 7 (strongly agree). Both skills get higher responses with ranges 4,5, and 6 (i.e., students agree with the statements at different levels), however the highest peak on distribution of learning skills evaluation has rate 5 (24 respondents - 47.06%), whereas the highest peak on distribution of memorization skills has rate 4 (22 respondents – 43.14%).
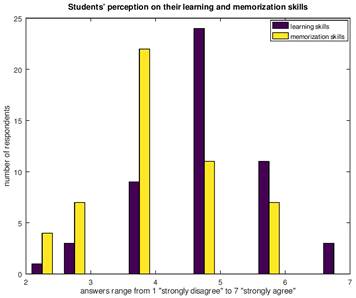
Fig. 5 Students’ perception on their learning and memorization skills.
Finally, we approach to the results of part 2 and 3 of our survey. In part 2 students used a scientific test [13] to help determine if they have some symptoms of ADD or ADHD which include difficulty concentrating, keeping organized, impulsivity, and for some, hyperactivity. Developers of this test claim that this is not meant as a diagnosis tool but rather its results to be interpreted as recommendation to possibly seek further diagnosis from a trained mental health professional in order to rule out a possible attention deficit disorder. Therefore, we use results of this test for the purpose of measuring potential symptoms of ADD/ADHD. After completing the test, a person gets instant results in three numbers: total score, inattention subscale, and hyperactivity/impulsivity subscale. The results of two subscales together add to the total score. Fig. 6 illustrates results of the test with three scores.
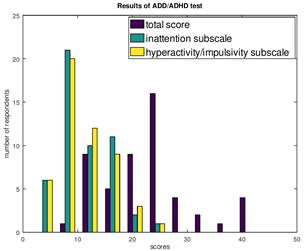
Fig. 6 Results of ADD/ADHD test.
The scoring key along with score results of the test is given in Table 2. According to these scores, majority of students have “ADHD possible” (37.25%), “ADHD symptoms” (25.50%), and “Moderate ADHD” (23.53%) results, whereas in subscale scores most of the students have low (60.79%) and moderate (33.33%) values.
Table 2. Scoring key and results for ADD/ADHD test
|
Total score |
Number of respondents |
Scores in subscales |
Number of respondents |
|
34 & up – Adult ADHD 26-33 – Moderate ADHD 19-25 – ADHD Possible 12-18 – ADHD symptoms 0-11 – No ADHD symptoms |
5 (9.80%) 12 (23.53%) 19 (37.25%) 13 (25.50%) 2 (3.92%) |
20 & up - - High 13-19 – Moderate 0-12 - Low |
3 (5.88%) 17 (33.33%) 31 (60.79%) |
In the last part of our survey we employ nomophobia test [12] in order to measure level of smartphone addiction among students. Fig. 7 illustrates results of this test among the survey participants. Three horizontal lines on the stem graph are to separate four levels of smartphone addiction from Absent (with scores 0~20) to Severe (with scores 100~140). According to this test, more than half of students (27 respondents - 52.94%) have moderate level which (according to [12]) refers to the fear of not being able to access information; 13 students (25.49%) have mild dimension of nomophobia which refers to fear of losing connectedness; and 11 students (21.57%) are indicated as having severe level of smartphone addiction which in nomophobia dimension refers to “giving up convenience”.
In order to conclude results of our survey we measured correlations between pairs of various responses’ samples and found moderate positive correlations between the following samples:
- q7_3 and NFT (r = 0.53316),
- q7_3 and TOT (r = 0.53248),
- TOT and NFT (r = 0.52304),
where q7_3 is the statement for students to rate from 1 (“never use”) to 7 (“most of the time”) – “How often do you use your smartphone during the classes for chatting through instant messengers”, NFT is nomophobia test result, and TOT is total score from ADD/ADHD test. Example visualization of one of the correlations (between TOT and NFT) is introduced in scatter plot in Fig. 8. Correlation coefficients r were calculated with a general Pearson’s correlation coefficient formula (1):
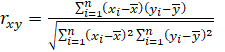 (1)
(1)
where x and y are the individual sample points.
Additionally, mild positive correlations have been found among the following samples:
- q7_4 and NFT (r = 0.40737),
- q7_11 and TOT (r = 0.46658),
- q13 and NFT (r = 0.44564),
where q7_4 is the statement for students to rate from 1 (“never use”) to 7 (“most of the time”) – “How often do you use your smartphone during the classes for checking SNS”, q7_11 is the statement “How often do you use your smartphone during the classes for just killing time”, and q13 is the statement to rate from 1 (“strongly disagree”) to 7 (“strongly agree”) – “I am happy to have my smartphone always with me”.
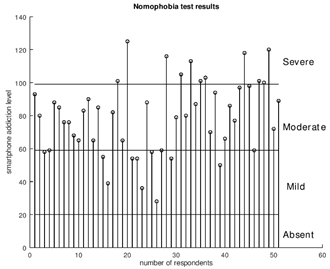
Fig. 7 Results of ADD/ADHD test.
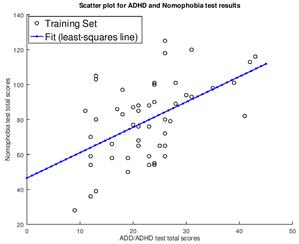
Fig. 8 Results of ADD/ADHD test.
4. Discussion and Conclusion
According to our survey results we found that students have mild (25.49%), moderate (52.94%) and severe (21.57%) levels of smartphone addiction. Referring to the first part of the questionnaire and taking into consideration correlation coefficients, it infers that the major fear students encompass is related to their possibility to communicate through instant messengers and SNS. In additional comments they mention the reason of being happy to always have smartphone with them as necessity to be always available to be reached by family members, friends, and/or to get important messages/calls on time. Somewhat meaningful correlation of nomophobia and ADD/ADHD tests with students’ use of smartphones during the classes (to chat through messengers and check SNS) can be explained as a result of behavioral culture in lectures environment – students are supposed to listen to professors, participate in study activities for some consecutive hours without watching their smartphones frequently at any time. This anxiety somehow distracts students from lectures at different moments and may influence on their study performance.
Our survey has also shown no relation of smartphone addiction to students’ learning and memorization skills, though recent studies [8] mention about “Google Effect” and “digital amnesia” due to individuals to believe they can access stored/necessary information at any time through computers/smartphones.
To conclude this paper, we acknowledge that sample size (51 participants) in our survey is limited to one university and two departments, along with all students being males, and may not represent its effect to the general population of students. Therefore, we plan to conduct additional research with expanding sample size and studying more thoroughly use of smartphones among students and professors involving smartphones in their courses.
References
[1] Y. Feng, M. Worrachananun, and I. Ka-WaiLAI, “Students’ preferences and intention on using smartphone education applications,” International Symposium on Educational Technology, pp. 109-112, July 2015.
[2] K. M. Höver and M. Mühlhäuser, “Classquake: Measuring students’ attentiveness in the classroom,” IEEE International Symposium on Multimedia, pp. 577-582, December 2015.
[3] E. C. Idemudia, M. S. Raisinghani, and A. Batch, “Empirical investigation of the cognitive factors that influence the continued use of smartphones by college students who are using smartphones to participate in the future global distributed teams,'' 47th Hawaii International Conference on System Science, pp. 289-299, January 2014.
[4] R. N. Morphitou, “The use of smartphones among students in relation to their education and social life,” IMCL, International Conference on Interactive Mobile Communication Technologies and Learning, pp. 315-319, November 2014.
[5] T. Rapeepisarn, S. Tatiyanupanwong,B. Kornvisitvatin,S. Tangsripairoj, “iRelief: An android application for smartphone syndrome prevention and treatment,” Fifth ICT International Student Project Conference (ICT-ISPC), pp. 121-124, May 2016.
[6] I. Rothe, “How to handle large classrooms of engineering students: sharing experience with applying three methods/practices including evaluation results and personal feedback,” EDUCON, IEEE Global Engineering Education Conference, pp. 11-14, April 2016.
[7] S. Shirali-Shahreza and M. Shirali-Shahreza, “Involving computer science students in real-world problems,” ITI, 30th International Conference on Information Technology Interfaces, pp. 569-573, June 2008.
[8] H.H. Wilmer, L.E. Sherman, and J.M. Chein, “Smartphones and cognition: a review of research exploring the links between mobile technology habits and cognitive functioning,” Frontiers in Psychology, vol.8, article 605, pp.1-16, April 2017.
[9] N. Yamamoto, “An active learning system using smartphone for improving students learning concentration,” 29th IEEE International Conference on Advanced Information Networking and Applications Workshops, pp. 199-203, March 2015.
[10] N. Yamamoto, “An interactive learning system using smartphone: improving students learning motivation and self-learning,” 9th International Conference on Broadband and Wireless Computing, Communication and Applications, pp. 428-431, November 2014.
[11] https://www.statista.com/statistics/489255/percentage-of-us-smartphone-owners-by-age-group/ (last accessed on Oct. 1st, 2018)
[12] https://lib.dr.iastate.edu/etd/14005 (Yildirim, Caglar, "Exploring the dimensions of nomophobia: Developing and validating a questionnaire using mixed methods research" (2014). Graduate Theses and Dissertations. 14005) (last accessed on Oct. 1st, 2018)
[13] https://psychcentral.com/quizzes/adhd-quiz (last accessed on Oct. 1st, 2018)